City Roadkills

City council members vote for policies that drive roadkills despite
3,000 times safer options

There is a choice: compliance protected by sovereign immunity (11,200 serious injuries per million) — or accountability to juries (3.7 per million at theme parks). See the full Two Systems comparison →

Lip-servicing the safety of children, violating the US Constitution since 1916, US city governments prioritized fast for cars.

Stop killing children on streets — apply the judgment of juries:

  • Remove sovereign immunity for complying to DOT standards.
  • Apply liability in jury trials using the 3,000 times better safety record of theme parks.

Restore liberty to innovate, adopt 5x5 Freemarket and roadkills can be reduced 60% in 3 years. The Netherlands provides a 39 year example of how to cut roadkill of children 97%.

STOP DE KINDERMOORD — STOP THE CHILD MURDER

In 1971, ~450 children were killed on roads in the Netherlands sparking "STOP DE KINDERMOORD" — STOP THE CHILD MURDER.

Dutch cities reduced killing children by 97%.

US city councils vote policies that keep killing children.

What the Dutch Did

Parents and children occupied accident blackspots. Streets were closed so children could play safely. Thousands laid down with their bicycles outside the Rijksmuseum, pretending to be dead. They cycled with an organ to Prime Minister den Uyl's house, singing songs demanding safer streets. The government listened. Child road deaths fell from 450 in 1971 to 14 in 2010 — a 97% reduction.

Sources: Streetsblog · The Guardian · BBC · London Cycling Campaign · Dutch Reach Project · Halifax Examiner · Medium · EJ Atlas · Palo Alto Safe Routes to School
Note: Sources report ~400 to ~500 children killed in 1971. Total road deaths were 3,300. We use ~450 per Streetsblog/Dutch Reach Project. The 97% reduction to 14 in 2010 is consistent across all sources.

What America Did

Nothing. The same year, America had similar per-capita roadkill rates to the Netherlands, Sweden, and Denmark. All four nations shared the same car-centric policies. After the 1973 Oil Embargo, Europe changed course. America doubled down on highways, borrowed trillions for foreign oil, and fought oil wars. Today, the U.S. pedestrian death rate is 4× higher than the Netherlands.

It took the Dutch 39 years of policy changes to gradually reduce roadkills of children by 97%, to 14 in 2010. City Councils in the US compounded the problem making roads faster for cars and more unsafe for children.

The Divergence

Same starting point in 1973. Radically different outcomes. Per-capita oil use diverged by 60%. Pedestrian and cyclist death rates diverged by 400%.
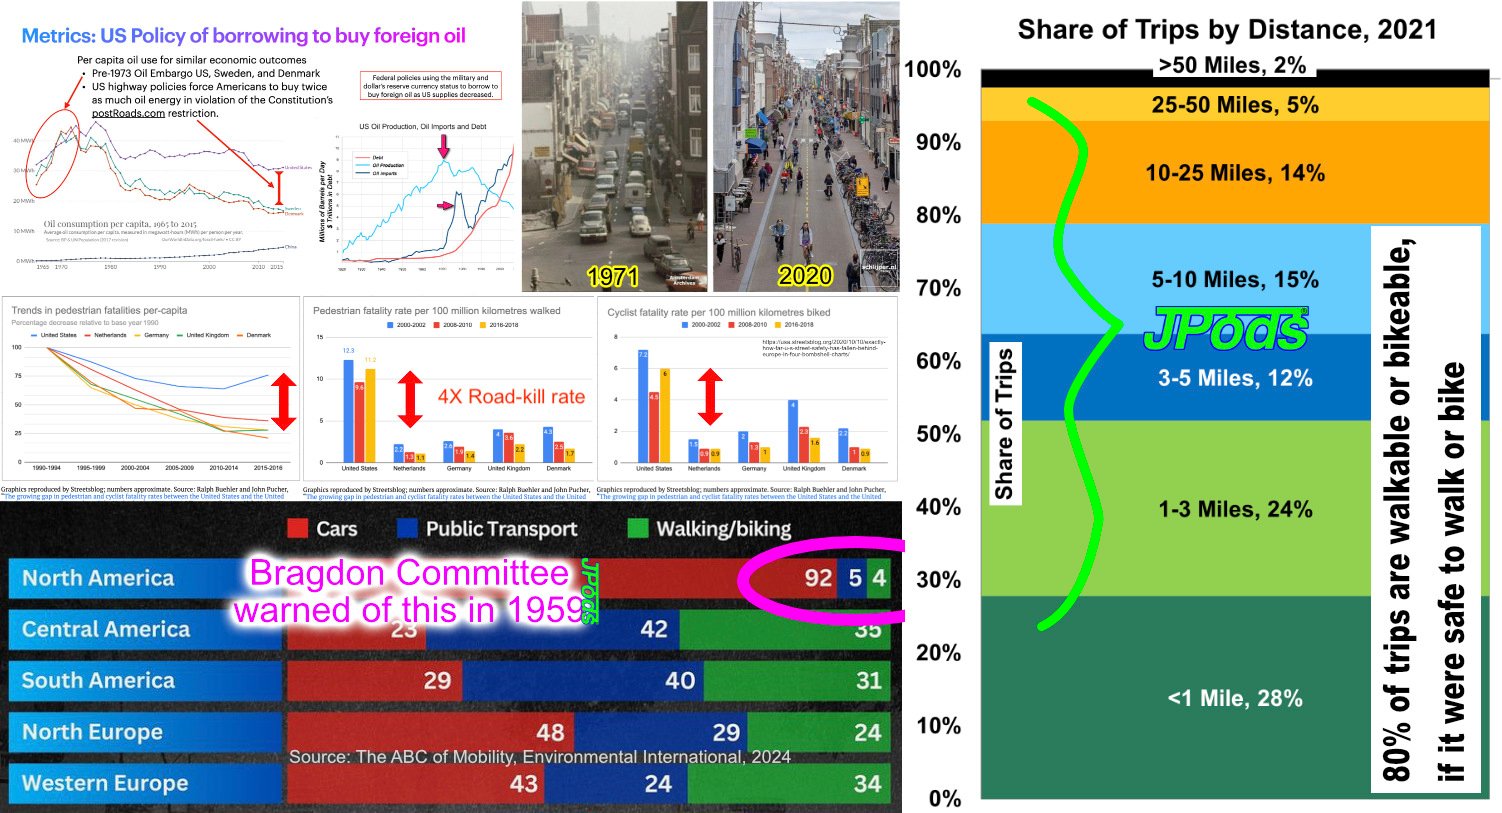
US vs Sweden, Denmark — oil consumption, roadkill rates, mode share divergence after 1973
Per-capita oil use, pedestrian and cyclist fatality rates, and mode share: U.S. vs Europe. Sources: Streetsblog/Buehler & Pucher, Environmental International 2024, IIASA.
60%
Less oil per person
Sweden & Denmark vs US
Higher pedestrian
death rate in US
92%
North America trips
by car
80%
Of trips under 10 miles
— walkable or bikeable

Roadkills in a city result from choices of its city council. We have known the solution is PRT (Personal Rapid Transit) since 1972.

Morgantown PRT: 0 serious injuries in 54 years. 150 million+ trips. The technology is proven. Full evidence: vetoes, oil quotes, Congressional study, Morgantown →

Tools

MeshMobililty.com provides maps showing roadkills in US cities. Anyone can use this tool to design a modern version of the Morgantown PRT. Modern podcar networks can cut roadkills in cities by 40-80% in 3 years.

Example Library

Cities where emails have been sent or assessments have been run. Use these as reference for your own city's letter. Every city's data comes from PersonalizeTransit.com.

CityStateNetwork CostAnnual SavingsStatus
ColumbiaSC$860M$420M/yrEmail sent July 27, 2026
GreenvilleSC$1BNetwork designed in MeshMobility
AshevilleNC$1BVideo at JPods3D.com
Secaucus / Hudson CoNJ$22.4BVideo at JPods3D.com
Tulsa MetroOK$6.8BAssessed (ChatGPT + Standard)
Nashville MetroTN$19.5BAssessed
Austin MetroTX$15.8BAssessed
MaconGA$9.1BAssessed
AnchorageAK$3.9BAssessed
RichmondVA$3BAssessed
Mall of AmericaMNMOU signed — building Fall 2026

Full library of 58 city assessments at PersonalizeTransit.com → Library tab.

Build Your Case

Four steps. Free tools. No permission needed.

1

Map the Crashes

Open MeshMobility. Find your city. Turn on crash overlays.

2

Design the Network

Place stations. Connect guideways. The crash corridors tell you where.

3

Run the Numbers

Open Personalize Transit. Enter your city.

4

Send the Email

Copy the template below. Attach your screenshots. Send.

The Email

Copy this template. Replace the highlighted fields with your city's data. Attach your crash map and network screenshots.

Email Template — Customize for Your City
Subject: Privately Funded Solar Transit Network for [YOUR CITY] Dear Mayor and City Councilmembers, People are dying on our roads. [YOUR CITY] has [NUMBER] fatal crashes and [NUMBER] total crashes per year. These are not accidents — they are predictable outcomes of car-centric infrastructure. The crash map attached shows the same corridors, the same intersections, year after year. In 1971, the Netherlands faced the same crisis and launched "Stop de Kindermoord" — Stop Child Murder. They redesigned their cities for people instead of cars. Child road deaths fell from ~450 to 14. Their pedestrian death rate is now one-quarter of ours. Their per-person oil consumption is 60% lower. JPods would like to fund the building of a solar-powered transport network in [YOUR CITY]. This is a roughly [$X BILLION] privately-funded investment requiring no taxpayer money. The numbers for [YOUR CITY] (from PersonalizeTransit.com): • Network Cost: [$XXX MILLION] • Annual Savings: [$XXX MILLION/YR] • One-Time Value: [$X.X BILLION] • CO² Reduction: [XXX,XXX TONS/YR] This is not theoretical. The Morgantown PRT has been solving urban traffic for 54 years with zero injuries and 150 million+ trips: • www.JPods.com/Morgantown • www.JPods.com/CongressionalStudy Attached: 1. Map of roadkill locations in [YOUR CITY] (from MeshMobility.com) 2. Example JPods network that would cut roadkills by 60-80% 3. Travel time isochrones — walk-ride-walk times without a car, 24x7, powered by sunshine Tools to explore this yourself: • www.MeshMobility.com — map crashes and design a network • www.PersonalizeTransit.com — calculate your city's payback • www.CityRoadkills.com — why this matters • www.5x5FreeMarket.com — the regulatory framework Privately funded JPods networks would cut roadkills by 60-80%. On-demand, personalized transit. No schedules. No car required. Powered by sunshine. Please let us know if you are interested. [YOUR NAME] [YOUR PHONE] [YOUR EMAIL]

What You Say

What Your City Gets

• 60-80% reduction in roadkills
• Mobility without a car — 24/7, any age, any ability
• Parking lots converted to taxable productive land
• Reduced road maintenance costs
• Solar energy surplus powering the neighborhood
• No taxpayer cost

Talking Points for Council

• "People are dying on predictable corridors. Here is the map."
• "A proven technology exists. It has worked since 1972."
• "A private company will fund the entire network."
• "The only thing you need to provide is the right-of-way."
• "The Netherlands cut child road deaths 97%. Why can't we?"
• "Why are we still killing people?"

Build Your City's Case

The tools are free. The data is public. The template is ready. The only thing missing is someone who cares enough to send the email.